
Sentiment Analysis of Brexit using Twitter Data with a Spatio-Temporal Approach
Introduction
As the volume of opinionated textual data generated increases with popular social platforms such as Twitter, so too does the importance to understand and analyse the public response with emerging social issues. Sentiment analysis has become favourable in both social and business applications in recent years as it has the ability to understand what people want. However, it also presents a diverse set of challenges.
This brings a more in-depth study of sentiment analysis with a large amount of social media data, to detect and analyse the sentiment patterns in both spatial and temporal dimensions.
This paper will focus on the event of Brexit, in particular; before, during, and after the 2019 General Election, discovering how the sentiment value of the public evolves.
Natural Language Processing will be used to detect sentiment values and Geographic Information Retrieval will be used to infer geographic information from tweets and geotags.
The approach of this paper differs from its related work since Density-Based Spatial Clustering of Applications with Noise (DBSCAN) algorithm is also used to detect spatial clustering grouped with similar sentiment values.
The results have shown that by using a combination of DBSCAN, ML, and data management techniques, it is possible to obtain encouraging answers to the research question. Codes can be found in this GitHub Repo.
Results
400,000 tweets were manually streamed from Twitter API with no location restriction between 28th November - 2nd December, and 11 December - 14 December 2019, filtered on the keywords of Brexit, Referendum, and General Election.
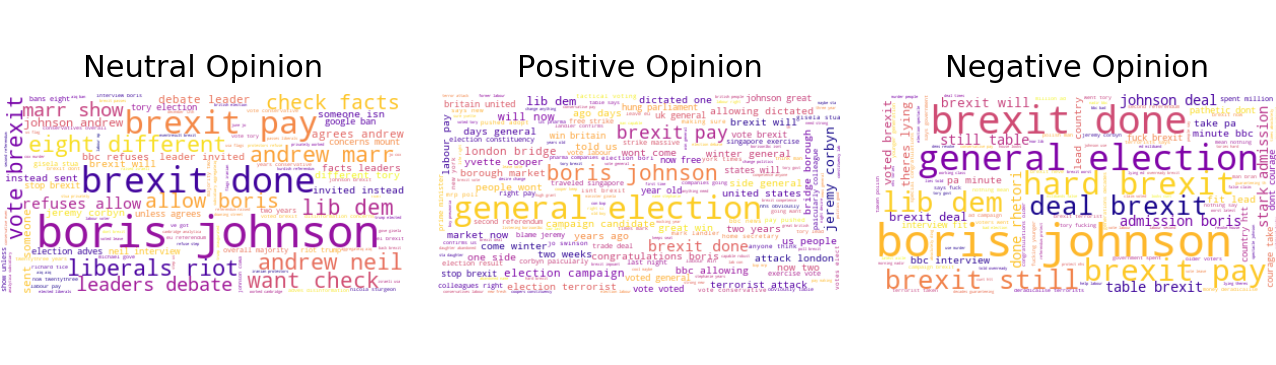
The above figure shows the word-cloud with the top 300 combinations of bi-gram with neural opinion on the left, positive in the middle, and negative on the right. The bi-gram of “Boris Johnson” is associated with more negative and neutral tweets than positive, it is also the bi-gram with the most tweets with negative opinion. The public are also more negative or neutral than positive when the word “Brexit” was mentioned.
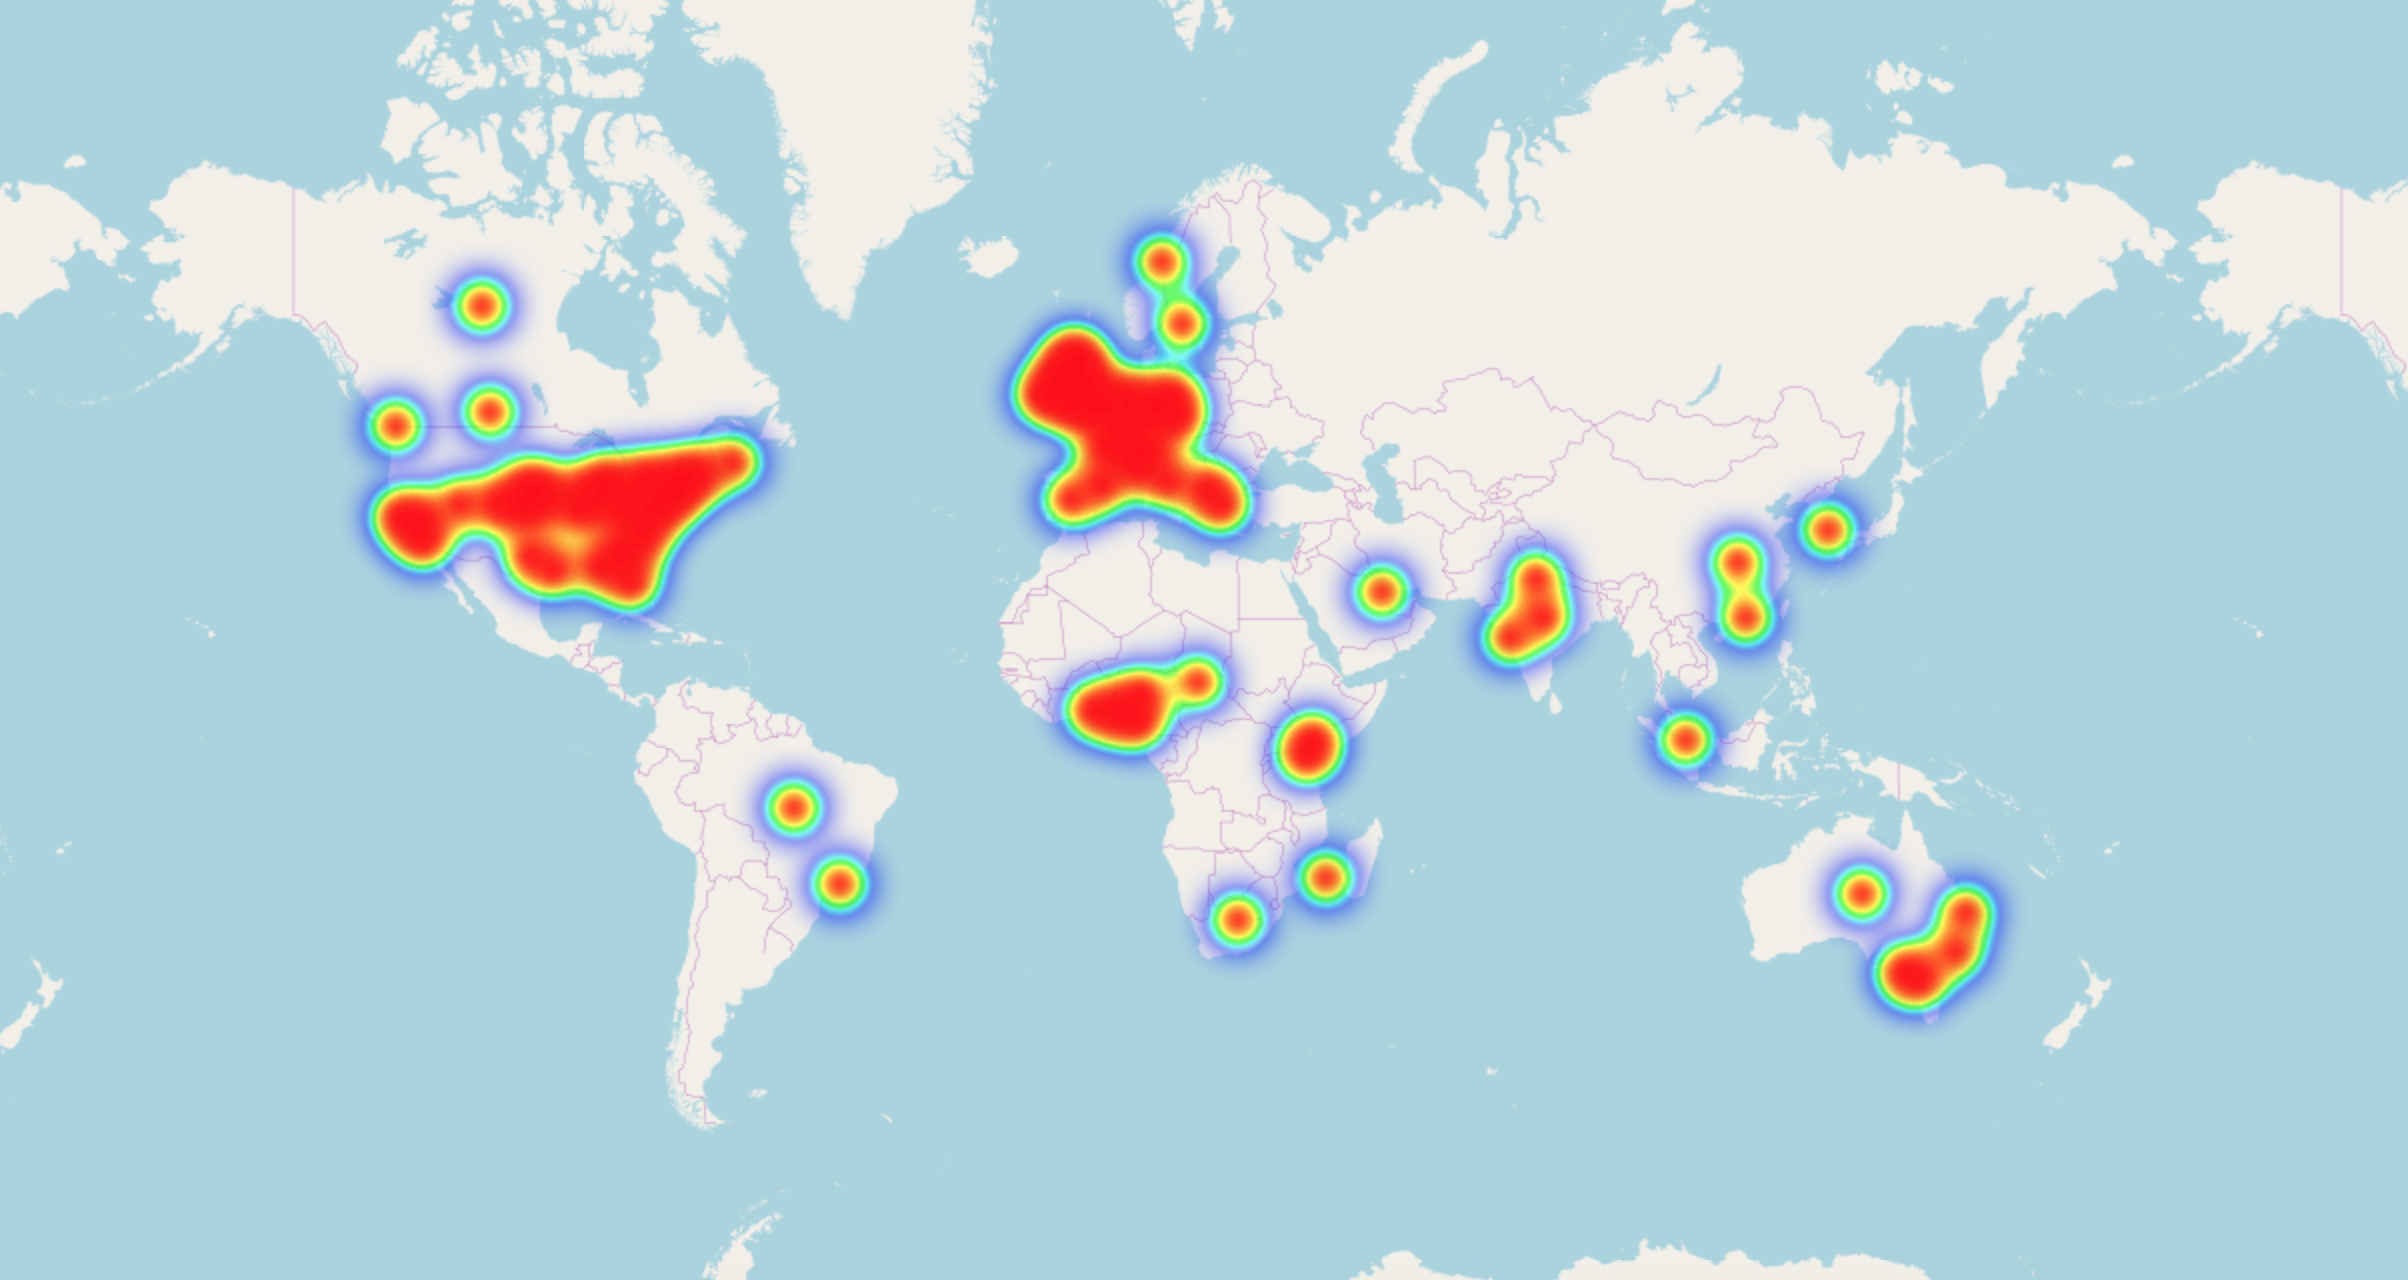
The heatmap above shows the number of tweets posted containing the keywords on a world map. It is clear that the majority of tweets were posted in the UK, however, it is surprising that there were also a considerable amount of tweets posted in the United States and rest of the world.
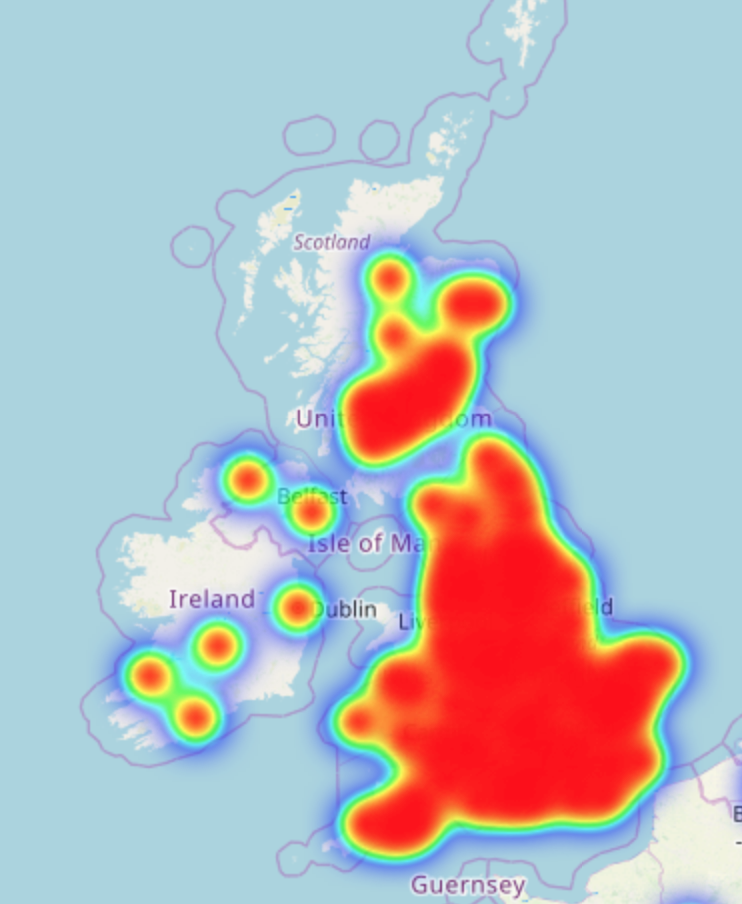
The UK heatmap shows the most tweets were posted around Greater London and all other major cities.
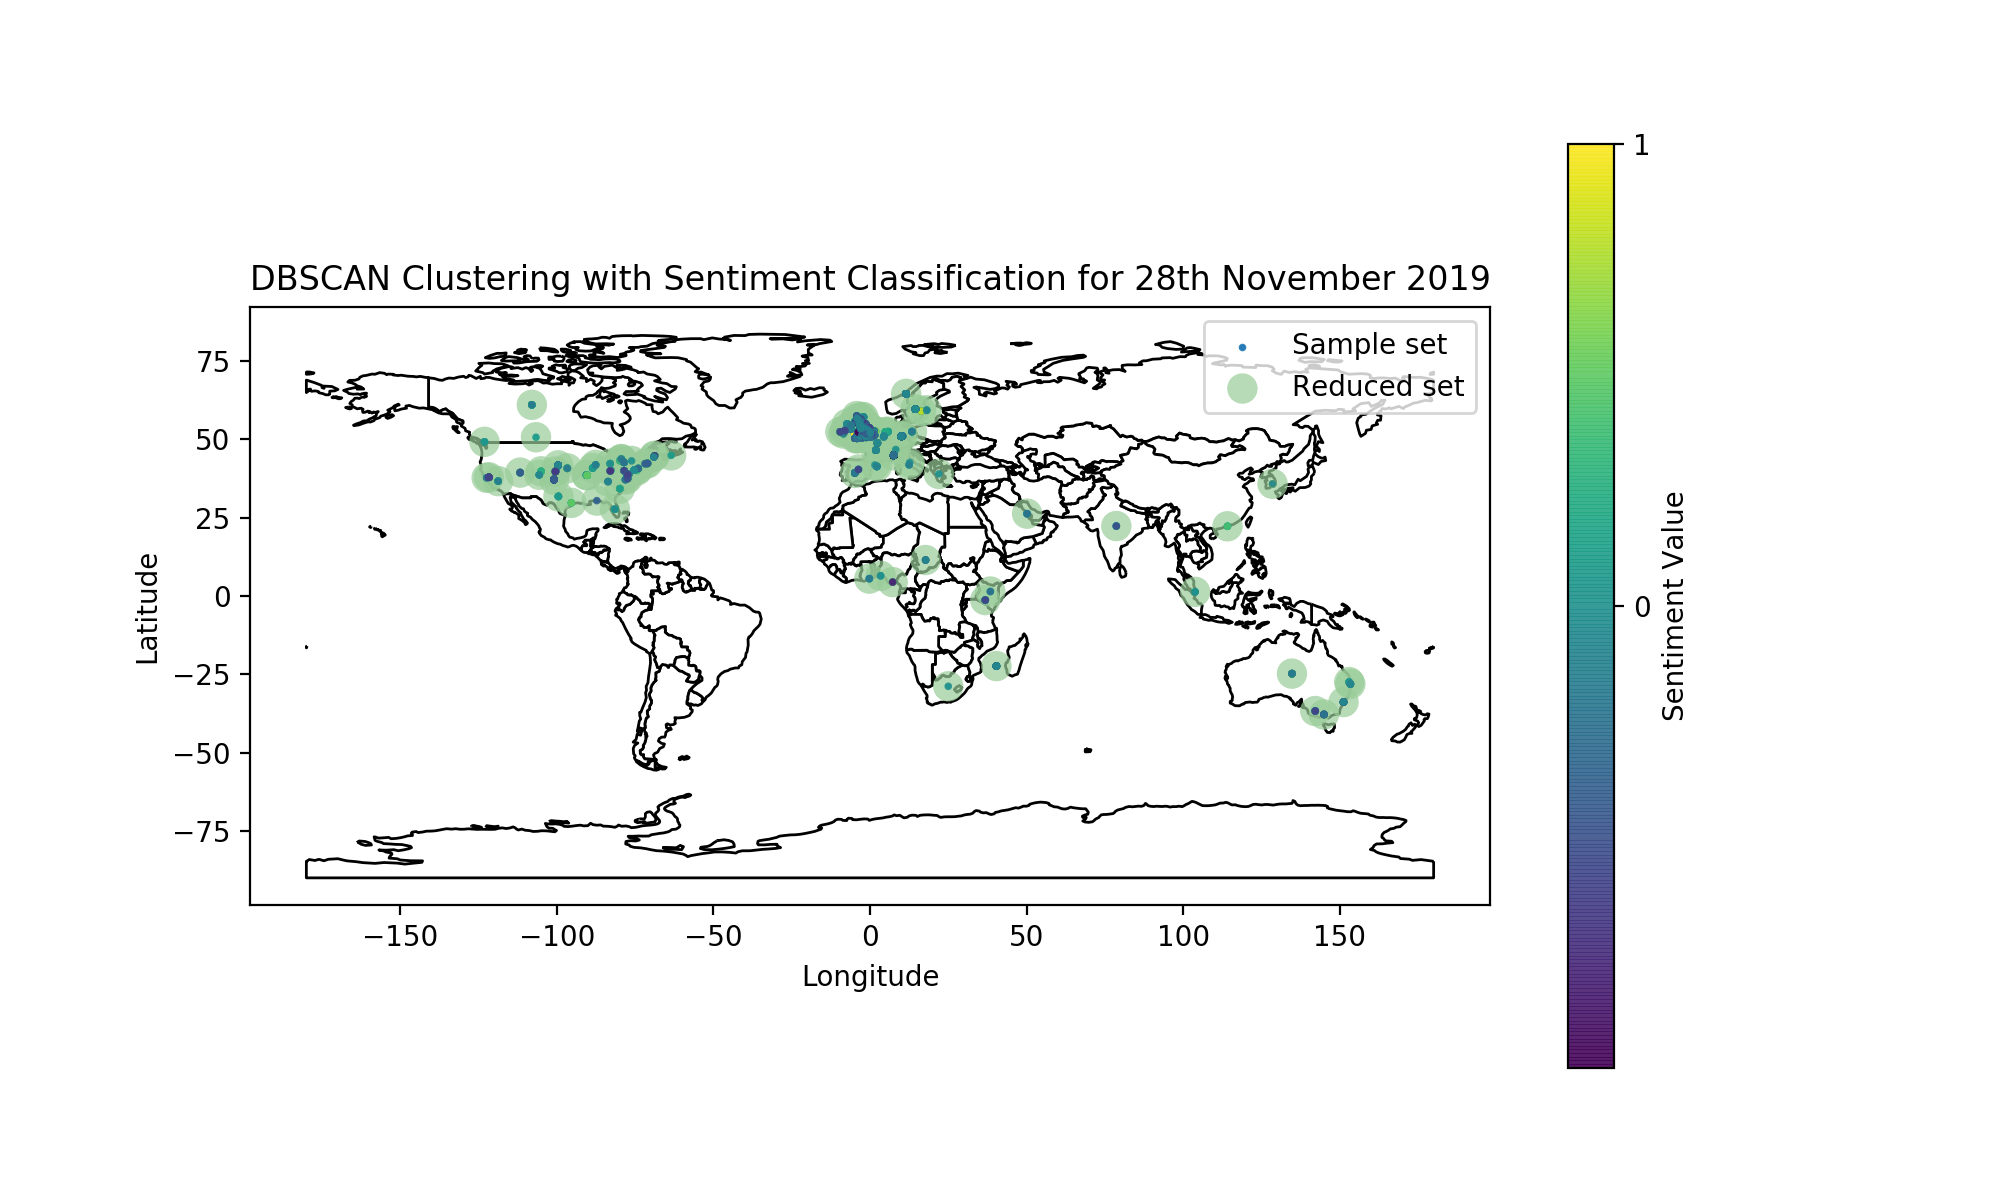
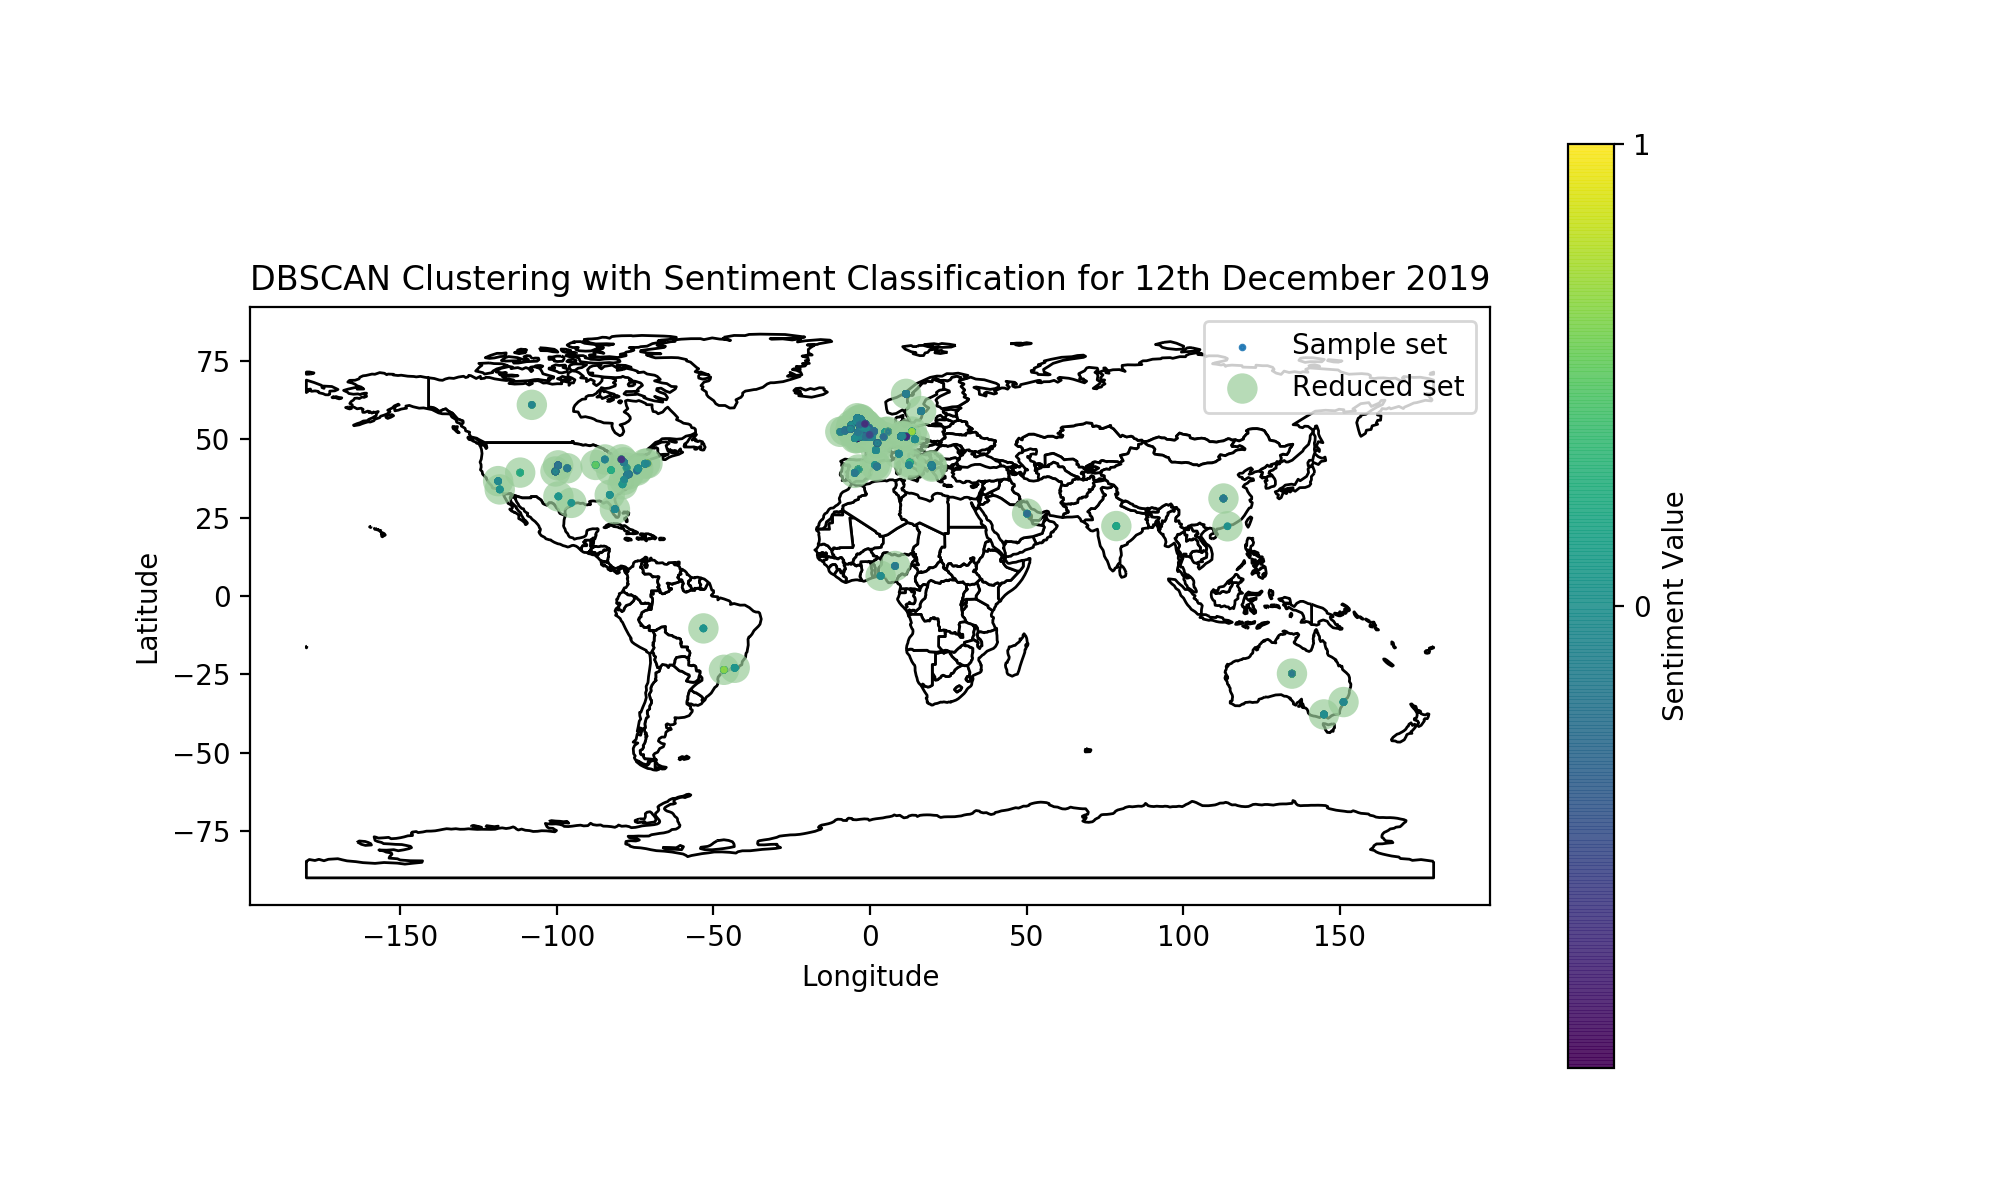

To be able to understand the evolution and to identify particular time periods or locations with either neutral, positive, or negative sentiment values, heat-maps were plotted with sentiment classification, DBSCAN clustering method, and at daily intervals on a world map in the above figure. In particular, three days are shown: 28th November, 12, and 14 December as representative samples of before, during, and after General Election.
The general opinion of the public towards Brexit was relatively positive before General Election, and gradually became more negative afterward.
The Americans and French were more positive towards Brexit, whereas the British were more negative. In particular, people in London and North East region had the most negative opinions. The result is consistent with the General Election results as London and Durham are one of the few constituencies in the UK with a majority Labour Party win.
However, as Twitter users are predominantly youths, the opinions analysed in this study were very skewed as General Election result has also shown that over 50% of the 18-30 age group voted Labour party, which are against Brexit. Whereas over 70% of the 70+ age group voted Conservative party.